
Clarity First
We focus on building reporting that is easy to understand, trustworthy, and useful in real business situations.
Structured analytics services designed to help growing businesses move from messy data to clear reporting, stronger visibility, and smarter decisions.
Our services are designed to improve data quality, simplify reporting, and create a stronger foundation for decision-making across your business.
We focus on building reporting that is easy to understand, trustworthy, and useful in real business situations.
Start with the right foundation now and scale into more advanced models and platforms when needed.
Every service is designed to solve real operational and reporting problems, not add unnecessary complexity.
The main ways we help businesses improve reporting, data structure, and visibility.

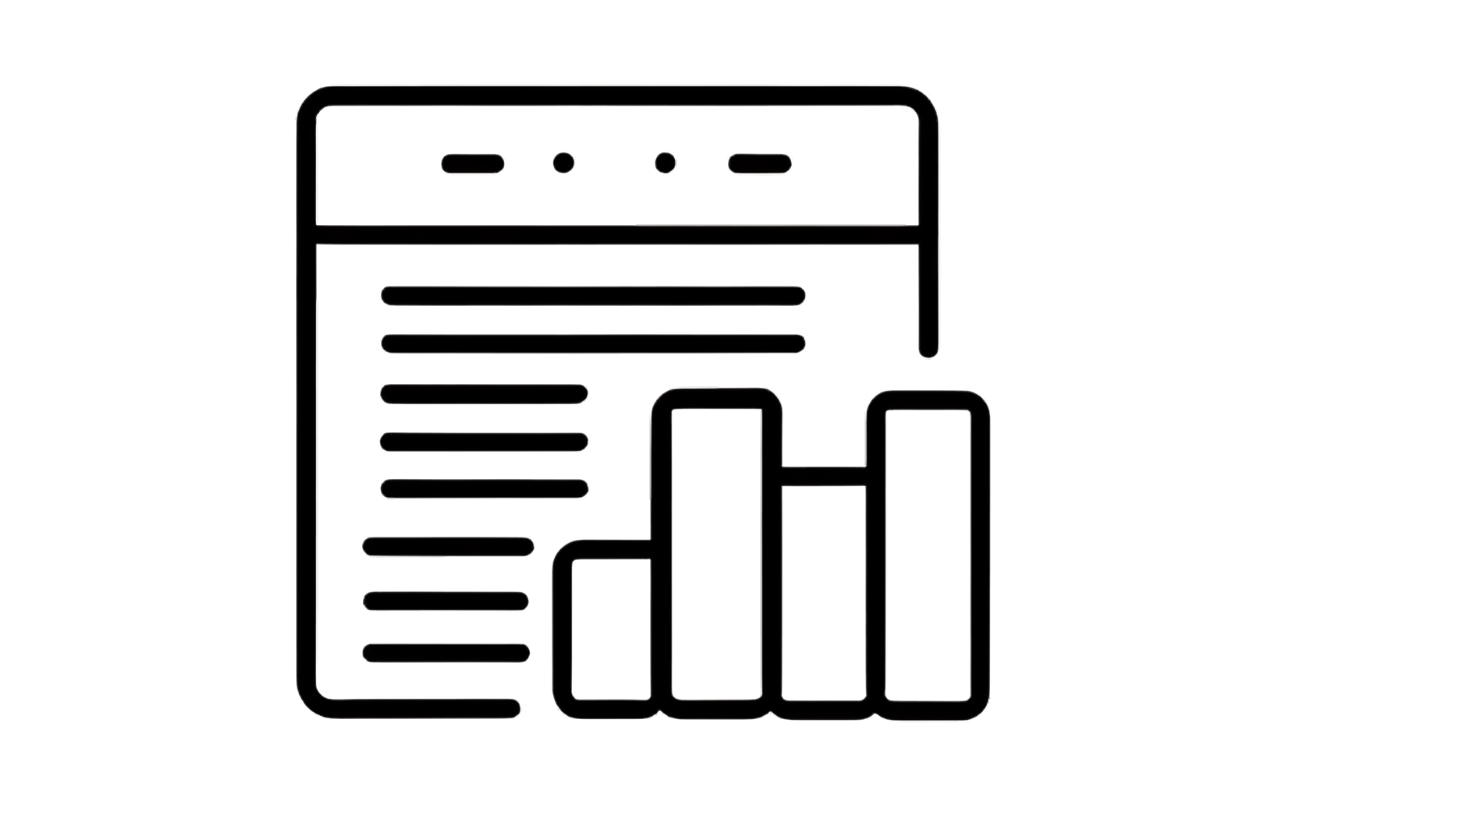
Interactive dashboards designed to answer important business questions clearly and quickly.
We build dashboards that give management and operational teams better visibility into performance, trends, and areas needing attention.

Fabric-ready solutions for businesses that need stronger automation, structure, and scalability.
We help businesses prepare for or grow into Microsoft Fabric with solutions designed for cleaner architecture and more scalable reporting.
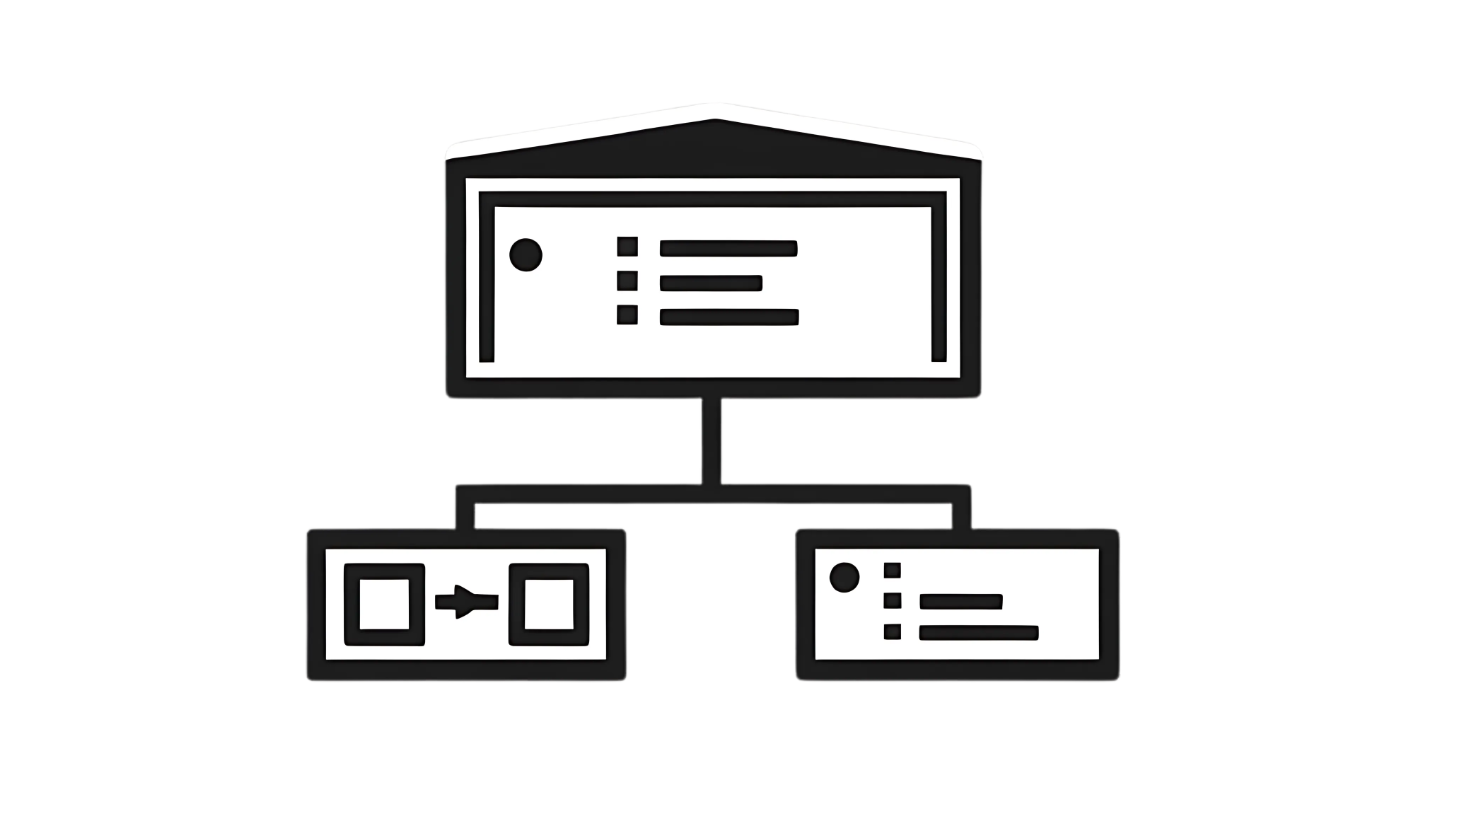
Clean, well-structured models that make reporting more consistent, accurate, and scalable.
We create structured semantic models using best practices so that your reporting remains trustworthy as your business grows.
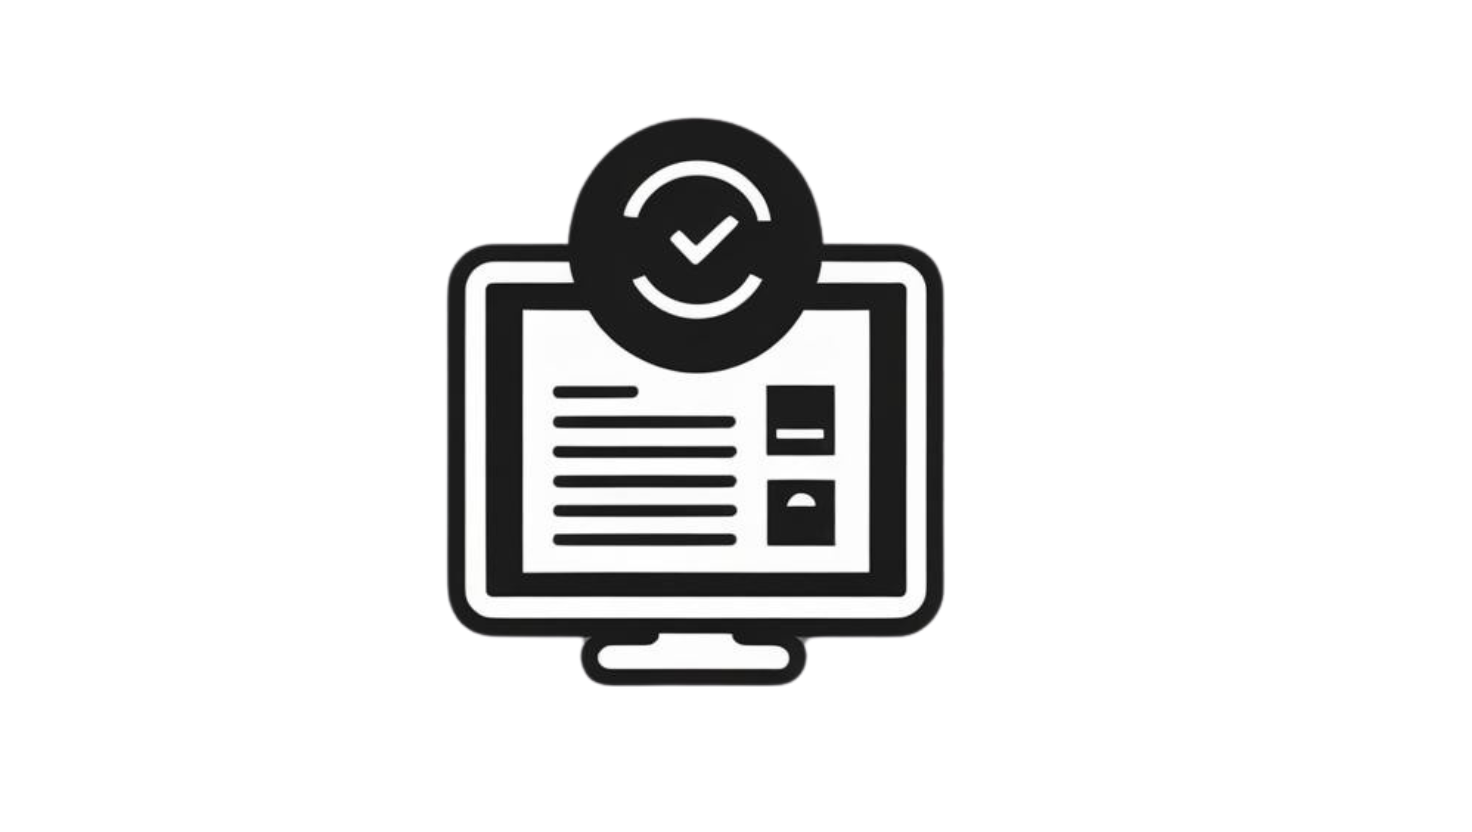
Improve trust in your data by fixing inconsistencies, reducing errors, and applying better controls.
Better reporting starts with better data. We help identify problems in source data and apply rules that improve reliability.

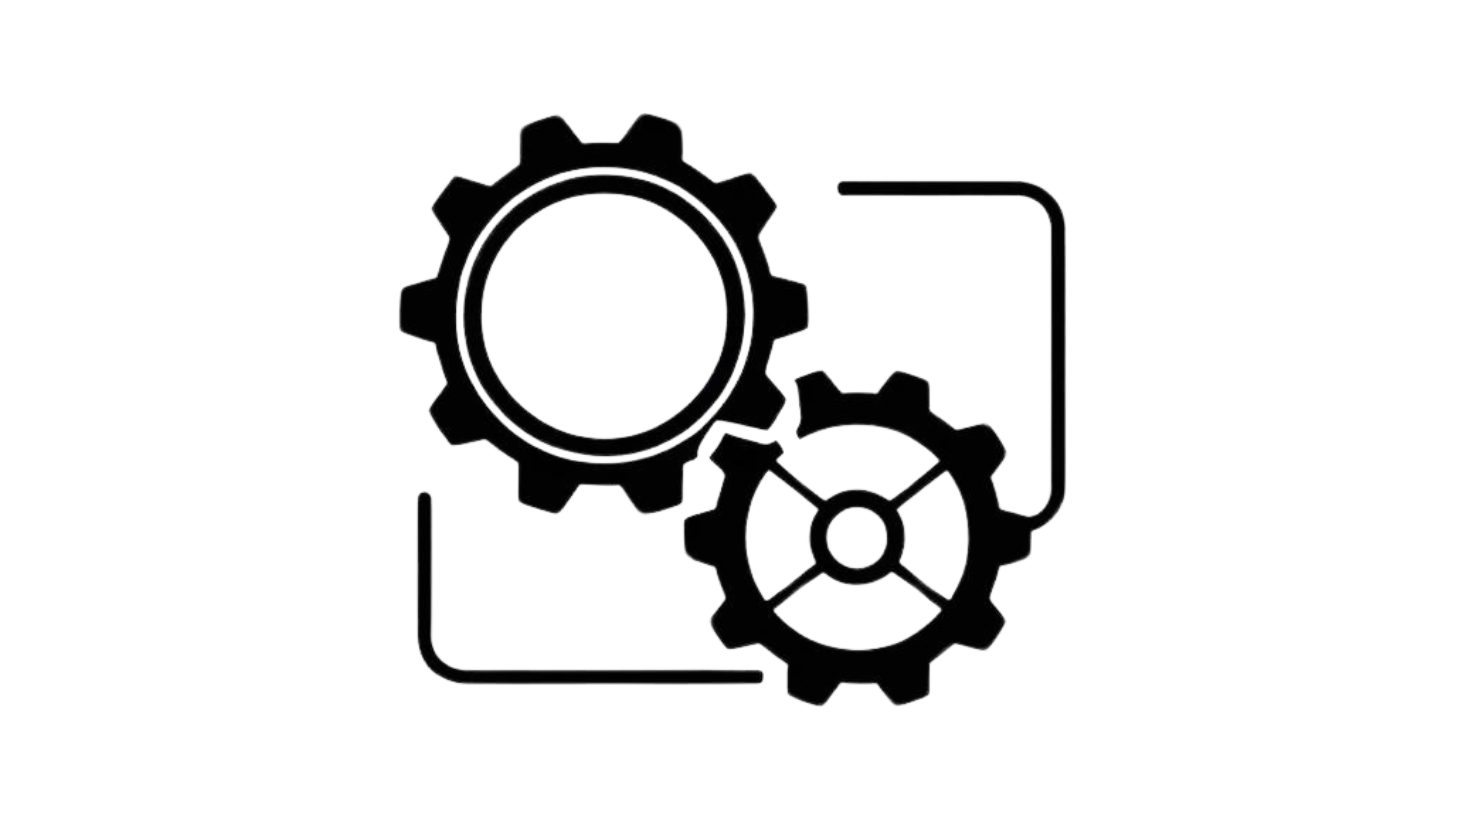
Bring data together in the right order with better refresh structure and fewer manual reporting steps.
We help build better reporting flows so that data is collected, transformed, and refreshed in a structured and repeatable way.
Add business meaning to raw data through classifications, calculations, and clearer context.
We enrich data so that reports become more useful, more understandable, and better aligned to how your business actually works.
Additional services that help businesses improve adoption, flexibility, and operational usefulness.
Make sure the right people see the right information, at the right time.
We help structure how reports are delivered so insights are easier to access, more secure, and more useful across teams.
Create views that are more relevant for different roles, teams, and decision-makers.
Different users need different levels of visibility. We help shape dashboards so they stay relevant and easier to use.
Help teams use reports more confidently and understand what the numbers actually mean.
Good reporting only creates value when people know how to use it. We support adoption through practical guidance and user enablement.
Quick, focused support when a business question comes up outside standard reporting.
Sometimes a business needs a quick answer, a special cut of the data, or a one-off view for a specific decision or meeting.
Improve existing Excel-based reporting with better structure, cleaner logic, and less manual effort.
For businesses not ready to fully move beyond Excel, we help make current reporting more reliable, more organised, and easier to manage.

Simple structured solutions for businesses taking early steps toward more organised data management.
Access can still play a useful role for smaller businesses that need more structure before moving into broader analytics platforms.
Our services are not just about tools — they are about creating better visibility, better structure, and more confident decisions.
See performance more clearly across operations, reporting areas, and important decision points.
Reduce spreadsheet dependency, repeated reporting tasks, and confusion caused by disconnected data.
Build a reporting approach that is cleaner today and easier to scale tomorrow.